Friday, September 29, 2006

Mozart says : Mathematics needs Marketing

First of all, thanks to all of you for being patient. The last week was really tough - exarcebated by lack of sleep and food - but enjoyable at the end for the insights i received from my work.

The title of this post is what the 'Mozart of Math' said in an interview yesterday (more on him later in the post). He just received the Fields medal last month.

The Fields medal
Is the Nobel equivalent in Mathematics. "Equivalent" because the Nobel is not given in Mathematics (seriously).

Basically, Nobel hated mathematicians because one of them had an affair with his wife. Well, that is the common masala story, the version you'd hear in a Bombay local train if your co-passengers had the same interest in math as in the stock market. This version has just one small problem : Nobel wasn't married. Rumour faila ne ke pehle at least thoda research kar yaar. Read about the more probable reasons here.

The moolah
Apart from being the 'Nobel of Mathematics', another reason why the Fields medal is highly regarded is because it's not awarded annually but once every four years + you have to be under 40 to get it. (They're so unreasonable, aren't they, these medal-wallahs?).

But get this. A Nobel gets you about $1,000,000. A Fields gets you $13,400. No. i am not missing out any zeros there. Thirteen Thousand Four Hundred Only. Of course, it's more about the prestige. But the sheer gap in prize money probably points to a problem that the title refers to : 'Marketing'.

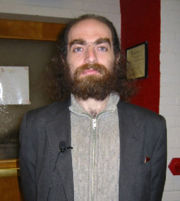
Now, before i get carried away and get into the 'marketing of math' issue, a little about the great mathematician who's quoted in the title. This is him:

Terrence Tao
Shocked? Baccha dikhta hai na?
(excuse the amount of Hindi used in the post. I don't know why i am doing this.)

Age countdown
Age 31 : Awarded Fields medal (this year)
Age 24 : Prof. at UCLA
Age 21 : PhD. from Princeton
Age 17 : Master's degree, Flinders Univ., Australia
Age 16 : Bachelors degree, " "
Age 12 : Gold medal at the International Math Olympiad (INMO) - youngest to date
Age 10 : Bronze medal at INMO

Called the Mozart of Math, except "he doesn't have Mozart's personality problems". And in the same link, his take on solving problems:
"It's not about being smart or even fast," he said in an interview at UCLA last year. "It's like climbing a cliff; if you're very strong and quick and have a lot of rope, it helps, but you need to devise a good route to get up there."

Doing calculations quickly and knowing a lot of facts are like a rock climber with strength, quickness and good tools; you still need a plan — that's the hard part — and you have to see the bigger picture."
And lest you think his work is an abstract math thing that has no relevance to day-to-day life:
"...work may have implications for possible new methods of encryption and security of information"
Link for the above quote here. Also see this for some idea on the kind of research he's doing.

Finally, check his university website out. In particular go to this link and do one 'page down' - i found it hilarious. First time i have ever read anything like that!

Reading about geniuses
When i first started reading about these geniuses about 15 years ago, i used to get really depressed. I felt so small when i looked at what all they had done. But thankfully i have somewhat overcome this over the years. I think it's even futile to pit yourself against someone else - higher or lower in talent. The operative word being 'pit'.

The best thing, IMHO, is to draw inspiration from these greats. These are thinkers who just keep pushing the limits even further showing us what the mind is capable of. In fact, to be honest, some of my problems have been solved after reading a Feynman story. It's like my mind says "Compared to the problems these geniuses deal with, my problems are so insignificant" And then just that thought of possiblity gives a breakthrough.

The other side of geniuses
Many (most?) geniuses have been known to have eccentric/troubled personalities. Famous examples being William James Sidin, John Nash.

So, let's say you were given two choices before you were born:
1) To be an extraordinary genius but be 'socially challenged'
2) To have an above-average intellect (enough to make a small mark) but be 'normal' in all other social aspects.

I'd anyday choose option 2). My colleagues/friends tell me that i'd do that because i am not in the position of a genius who's so absorbed in his work and derives so much of joy from it, that it doesn't matter to him. Well, i don't know. Reality is different. Take for example , Grigori Perelman.
Won the Fields medal this year along with Terence Tao. Refused it!

I find him such a fascinating personality for other things like this:
"Friends say evidence of Dr Perelman's innate modesty came when - having finally solved the problem after more than 10 years' work - he simply posted his conclusion on the internet, rather than publishing his explanation in a recognised journal.

"If anybody is interested in my way of solving the problem, it's all there - let them go and read about it," Dr Perelman said. "I have published all my calculations. This is what I can offer the public."
Guess what? He's currrently unemployed living off his mother's pension! In fact, he's apparently so disillusioned that he's given up mathematics! (ala Sidin). Read about it here.

So, is he happy? No way. What happens then to all that 'math for math's sake' and 'derive joy from the process' stuff. The question is what's the point in being a genius if you're not happy. But, i guess one doesn't have a choice. You are just born one. That's your burden. As for me : anyday option 2.

Friday, September 15, 2006

Ann Arbor Flora : Hibiscus or Dish-Antenna?

Well, it was a large Hibiscus no doubt. I tried taking it an angle that would communicate the size well. But didn't bargain for this:


Wednesday, September 13, 2006

Ann Arbor Flora : Playing with the Sun


Might be good to add: The dual colours above are due to the Sunlight. One case, where the Sun gives rise to duality! Philosophically, the Sun stands for Advaita (non-duality) but let me not get into that right now...

Monday, September 11, 2006

The Prez's website. And the PM's?

Dr. Kalam, President of India, one image of statesmanship.

Apparently his website was a great hit on Independence Day. 10 million hits. Link to the news article here.

This is Dr. Kalam's website. The official one. The website speaks. This is from the children's section:
We invite children from India and all across the globe to ask questions on the topic of their choice to Dr.APJ Abdul Kalam, The President of The Republic of India. Selected questions and their answers shall be displayed on this site.
Hey, they also have a contest on the website for kids ('Tinkle contest')! . i thought that was cool!

He also has a personal website here. (The footnote says "promoted by his friends and admirers")

Now, if abdulkalam.com was cool, what happens when you do manmohansingh.com?

Anyway, here is the official website. Compare to the Prez's.


Thursday, September 07, 2006

Vande Mataram : Salutations to the Motherland

Vande Mataram is India's national song. A song that can move the hardest heart to tears, a truly inspired composition, in the fullest sense of the word.

Today is celebrated as the marking of the 125th year of the song, composed by the Bengali poet Bankim Chandra Chatterjee. Here is the English translation of the song by Sri Aurobindo Ghosh who was a great mystic.
Mother, I salute to thee!
Rich with thy hurrying streams,
bright with orchard gleams,
Cool with thy winds of delight,
Green fields waving Mother of might,
Mother free.
Glory of moonlight dreams,
Over thy branches and lordly streams,
Clad in thy blossoming trees,
Mother, giver of ease
Laughing low and sweet!
Mother I kiss thy feet,
Speaker sweet and low!
Mother, to thee I bow.
Who hath said thou art weak in thy lands
When swords flash out in seventy million hands
And seventy million voices roar
Thy dreadful name from shore to shore?
With many strengths who art mighty and stored,
To thee I call Mother and Lord!
Thou who saves, arise and save!
To her I cry who ever her foe drove
Back from plain and sea
And shook herself free.
Thou art wisdom, thou art law,
Thou art heart, our soul, our breath
Though art love divine, the awe
In our hearts that conquers death.
Thine the strength that nerves the arm,
Thine the beauty, thine the charm.
Every image made divine
In our temples is but thine.
Thou art Durga, Lady and Queen,
With her hands that strike and her
swords of sheen,
Thou art Lakshmi lotus-throned,
And the Muse a hundred-toned,
Pure and perfect without peer,
Mother lend thine ear,
Rich with thy hurrying streams,
Bright with thy orchard gleems,
Dark of hue O candid-fair
In thy soul, with jewelled hair
And thy glorious smile divine,
Loveliest of all earthly lands,
Showering wealth from well-stored hands!
Mother, mother mine!
Mother sweet, I bow to thee,
Mother great and free!

Wednesday, September 06, 2006

Decimal Points and Accuracy...

...are not exactly equivalent.

This is a common misconception. Many clients demand more decimal points to the reported data saying it'll be 'more accurate'. No! This is not an accurate statement to make (pun intended, thank you)

A radio announcer saying that "Today's temperature is going to be 70.83018460288453 degrees F" does not make that estimate accurate!

That 70.83018460288453 may be very far from the truth of say, 60 deg. F, though the measurement is precise.

Here's a quote from 'Common Errors in Statistics' , Good and Hardin, 2003 (Glossary on page 187 ) :
"An accurate estimate is close to the estimated quantity. A precise interval estimate is the narrow one. Precise measurements made with a dozen or more decimal places may still not be accurate"

Monday, September 04, 2006

Bar chart gone bad

This is from a mailer i received. (channel names masked)
The good part
The data is a 13 week average. Averages are always good. And this is a nice quaterly average.

Now,
The not-good part

1) This is ONE-DIMENSIONAL data
...but a SECOND DIMENSION is used (unfairly, in my opinion) to give a false sense of extra superiority. In other words, all relativism in the graph should lie on one axis ONLY since there is only a single variable (presumably TVR%) that is being studied.

But what's happenning on the X-axis?
See how the two bars are of different widths? Even right at the base. And the relative widths go on increasing as the X-axis values increase. So there is a correspondence between the X-axis values and the bar widths. But the data is supposed to be one-dimensional!

The lie-factor
Edward Tufte, the person who has probably contributed the most to the science and art of data visualization introduced a term called the lie factor in the 80s (?). It's the ratio of the 'size of graphic' to 'size of data'. if a lie-factor = 1, then the graph is true to the data. But that's not the case here.

It is interesting to calculate an approximate lie-factor here. Now given that the area of the two bars are not of a standard shape we make use of a 'Monte Carlo estimation' process. Simply put:
- We spray the graph with dots or throw darts at it like below (sorry for the bad quality).
- Then just count the number of dots or darts in each bar of the above graph
- In this case, we want to compare areas, so we take a ratio of the number of dots
- Of course, this is an approximate estimation method. The approximation improves with greater dot density

So, what's the lie-factor?
- It turns out that the ratio of number of dots in the Channel A bar to Channel B bar is 5.5
- And the actual data? Judging this from the graph is made difficult since the axis is tilted. But looks like it's 0.89 and 0.8 for channel A and B respectively. This gives us a ratio of 1.11
- So the lie factor here is 5.5 divided by 1.11 = almost 5! (4.95)

In other words, the graph bloats the actual data effect by a factor of 5!

Assuming a one-one equivalence with the average human mind's perception and the lie-factor, a person would assume that Channel A's viewership is 5 times more than Channel B's while it is actually almost the same!

2) No axis label
The reader has to assume that the data is TVR% data and not, say, Reach% data. Or could it be channel share data? All three are metrics expressed in %s but are very different concepts having specific application in media strategy. For me, this graph is saying "Don't worry about what the numbers are. Just focus on the fact that we're number 1". It's almost taking the media literate reader for granted.

3) The axis itself
- Why are the axis non-orthogonal i.e why aren't the X and Y axis are not perpendicular to each other? They should be in this case. Are the axis tilted to highten (falsely) channel A's numerical superiority
- How does one read off the bars? If you draw a straight line parallel to the X-axis as you should, you 'll read it wrong with this tilt.
- What's with the Y-axis on the right. Not that it matters at all actually but just curious since the convention is to have it on the left.

4) Significance
Is the relative advantage in TV ratings even statistically or practically significant to talk about?

5) Scale
Maybe you noticed that when we took the ratio of the actual numbers it came to 1.11 = saying that the numbers are almost the same! But starting the axis values (origin) at about(!) 0.75 rather than zero adds to the perception skew.

Here's what my redone graph looks like
....when i do the rescaling and other changes:
The only decoration i have done is that HUGE greater-than sign. Is that also lying?