In everyday parlance, the two - Precision and Accuracy - are often used interchangeably. In the field of statistics however, the two terms denote separate ideas.
Let's say you undertake a survey where the outcome of interest was 'Average annual income of undergraduate students in the University of Michigan, Ann Arbor'. And you got $2000 as an estimate.
However, like a good statistician you doubt whether this was a 'good' estimate. So you repeat the survey again - using the same survey design. This time you get $3000. Hmmm....quite a variance i.e this estimate is quite different from the earlier one.
So to be really convinced you do the survey again using the same survey design and end up with $1000. Wow! These numbers are really 'fluctuating'. You are now rapidly running out of time and money. So you promise yourself that you'll repeat the survey just one last time. And this time you get an estimate of $2,800. What's happenning? Why are these numbers so different? You've got four estimates : $2000, $3000, $1000, $2800.
You decide to discuss this with your friend, Peter, who was also coincidentally at that time conducting a similar project. Peter says "That's funny. I got the following estimates: $7,500 , $8,000 , $7,200 and $7,700"
Now both of you are confused. We have two issues on hand:
1) Why is it that your estimates are all over the place?
2) Why are your estimates so different from Peter's?
Fear not. Fortune favors the intelligently persevering (and now i'm sounding like Aesop). You stumble upon a previous study that said that the 'Average annual income of undergraduate students in the University of Michigan, Ann Arbor' is $2200 for the current year. The difference between this and Peter's/your study is that this is based on a Census. In other words, based on a complete coverage of all students.
Your numbers are however an estimate of this true number since you have sampled only a part of the student population. But guess what? You find - surprise, surprise - that your estimate on average is equal to the true value. That is, you take an average of your (four) sample estimates and this is equal to the true population mean.
II. Relation with Bias and Variance
1) Your estimate is therefore an Accurate estimate. UNBIASED. But you also note that your estimates are varying ('fluctuate'). They are therefore not very Precise estimates.
2) Peter's estimate were on the other hand NOT ACCURATE. They were on the higher side. There was a BIAS (a positive bias). But to be fair they were PRECISE estimates. They had relatively LOW VARIANCE i.e the estimates were close together.
Thus:
HIGH Accuracy => LOW Bias
HIGH Precision => LOW Variance
III. Visualizing Accuracy and Precision concepts
The best way to do this is to imagine that you were playing a game of darts. You then have four scenarios depending on whether the Accuracy and Precision is 'Low' or 'High'. See the following diagram (click to enlarge if required). See how your estimates and Peters' were between the two extremes of Ideal vs Sinful (!) estimates. Just for ease of visualization this has been represented in the form of a 2 dimensional picture. With reference to this example, just look along the horizontal line - the dotted line that i've drawn.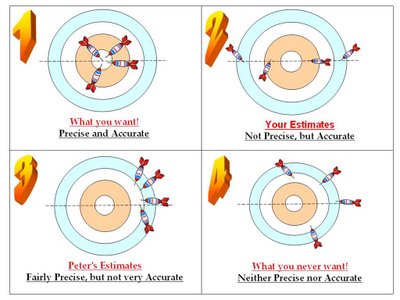 IV. But do we really conduct repeat surveys
 IV. But do we really conduct repeat surveys
No! In the practical world, we never have the luxury of time or money to conduct repeat surveys to see how good our estimates are. In practice, the survey statistician would first ensure that the design is UNBIASED. Along with ensuring unbiasedness, a survey statistician would ensure that the variance of the estimate was low. In your case, you had an unbiased sample. The reason for high variance was probably low sample size.
In Peter's case, he probably had a 'helpful' friend living in an off-campus condo who offered to introduce Peter to his friends in condos around. Obviously, these were all also those who worked in places offering higher wages (how else a condo :) , which is why his estimates were biased. The sample of course, is not a random sample and is unscientifically done. So it matters little that his estimates were precise since they were quite biased.
Also, please remember that the fact that the average of your four estimates is equal to the population value is just for illustration. The property of unbiasedness (or lack of it) is on average across many, many estimates.
V. Two basic reporting components
To enable the research user to assess precision, we always report the Margin of Error along with the Estimate in research reports/presentations i.e Estimate +/- Margin of Error; which gets expressed as a Confidence Interval. The estimate, of course, is designed to be unbiased ('tending to' the true population value after many runs)
27 comments:
good funda.
however, fig. 2 is confusing, unless untill one understands that all the darts are expected to be near the horizontal dashed line.
Thanks for the feedback, SSK. I agree. Don't know how else to show it though. Will think about this one.
i shall need a lot more time to go through this one. :)
A question: every time you do a survey, there is a possibility that you may get different result. Now, which of these will you take seriously to fix your strategy?
I will send you my finding of the survey that we undertook recently. the findings were quite different from the findings of what we had done last year. But there were some differences in the manner in which we conducted the survey. last year, we did a quantitative survey and this year we did a qualitative survey with open ended questions. Now as a decision maker, which survey would you take seriously and why?
Hi Aarshi,
But it's much easier than understanding your hi-fi poetry :)
Sandeep-sab,
> A question: every time you do a survey, there is a possibility that you may get different result. Now, which of these will you take seriously to fix your strategy?
Yes. But the way surveys are (rather, should be) designed are in a way that they are Unbiased. Which means samples have to be 'representative' of the population of interest.
Any unbiased survey should be taken seriously. Of course, the sample size has to be decent enough to allow for decision making i.e the margin of error (that i mentioned in the post) has to be narrow enough. eg. for an incomes survey with a mean income of Rs. 25000, can't have the margin of error as Rs. 20,000!
> I will send you my finding of the survey that we undertook recently. the findings were quite different from the findings of what we had done last year. But there were some differences in the manner in which we conducted the survey.
Exactly. But even if the survey was done differently, both surveys would have been (rather, should have been) representative. If so, then the changes you see in the results would be the 'real' changes in the population. Of course, for each of these designs you should be given a margin of error so that makes things kinda comparable.
> last year, we did a quantitative survey and this year we did a qualitative survey with open ended questions. Now as a decision maker, which survey would you take seriously and why?
Actually, they go hand in hand. Each has it's own strengths. The advantage of a quant. survey is that one can use mathematical results to extrapolate sample results onto the population. With a qual. survey the effort is more at insight-generation. The results of a qual survey can be taken forward to a quant survey to get a population estimate.
I'm sorry, i'm writing this in a hurry...please let me know if not clear...thanks...
public to gyan dene ke liye thiek hai. Kaam chala lunga! Thanks.
> public to gyan dene ke liye thiek hai. Kaam chala lunga! Thanks.
Arre...gyan aap doge to mein kaam ke baahar ho jaoonga :)
Wow. That's like, the best explanation I've ever had of this funda. Not that I've had too many, but this was the best ;)
My blog has entered retirement. Visit and leave an obituary, and many tears.
Hi Sharan- great classroom post. Always good to revisit these basics and understnad them a more simple manner!
thanks
Glad you liked it, Ajith!
>Arre...gyan aap doge to mein kaam ke baahar ho jaoonga :)
Jab tak aap wapas nahi aate ho, mujhe hi gyan dena padega, Na???!!!
Sharan,
I think the general misunderstaning is because people do not think in term of statistics.
I think that for lay men (like me )it is a degenerate case with sample size == 1, in which case,
precision should have same meaning as accuracy
Regards
That's an interesting one, Gaurav. Thanks. Will respond to it in a while.
"estimate on average is equal to the true value"
"average of four sample estimates is equal to the true meam"
not clear .Is it something like compounded mean of four groups is equal to the true mean
Hi xyz,
thanks for your comment. will reply to this today...just rushing out now :)
Hi xyz,
Just before replying to your comment...also noticed that i had forgotten to reply to Gaurav's comment:
> ...with sample size == 1, in which case, precision should have same meaning as accuracy
Actually, here these terms should not probably even be invoked. After all, there is no concept of "variation" with a sample size of 1.
The nice question you asked, xyz:
1) "estimate on average is equal to the true value"
"average of four sample estimates is equal to the true mean"
Yes, you're there...as in, it is a mean of means. An average of the averages. Inferences in statistics are done on the basis of this 'on average' which basically means that you cannot tell how far you are away from the population mean (you don't know this, right?) for a mean based on ONE specific sampling exercise that you've undertaken. But you *can* give an estimate of how far you are from the population mean *on average* - that is, if you were to repeatedly undertake sampling under the same conditions, on an average you will be "xyz" (no pun intended!) away from the population mean. Statistics allows us to make those kind of statements, which is great because ultimately we still don't know the value of the population mean but can tell how far away we are from it, *on average*!
Does this help? if not, please let me know. Thanks.
Sharan sir,
you said something like this .the average income based on census was $3450.Suppose you did not have access to this data,would you have been to predict how far from the mean your survey was.and how accurate that prediction is.what are the parameters.Is it possible to explain the terms in simple language or give some links.when you have time.thank you sir (ha!ha!ha!)
xyz sir,
Yes, you will normally never know what the population mean is. But that's the fantastic part of stats. Even without knowing it, you know how far you are away from it, on average! It's like magic! And this comes from a mathematical proof.
To know this distance, you use a formula given by s/sqrt(n) - where s is the standard deviation of your sample data. That is, you collect your sample data and find out the average distance of these sample units from their average. And 'n' is your sample size. This s/sqrt(n) is also called the standard error (se)of your estimate - that is, if you were to conduct this exercise many, many times, on an average your estimate would be 'se' units away from the population mean.
Does this help a little? Please let me know if you don't understand. And yes, the fees are $20 a reply for this. I accept credit card payments.
Thank You,i think i got it after reading about estimate and margin of error,confidence interval etc.missed it in earlier reading.Was it there from the beginning?what was the margin of error for your survey.my last post.hope you will find time to answer.
No problem, xyz.
Actually you don't have quite the information here to calculate that. But assume that we had gone to 100 respondents (this is our sample size) and that the average distance of the annual incomes was $500 from the mean (this is the standard deviation of the sample incomes that you collect).
Then the margin of error comesout to be $100 at a 95% confidence interval. So a 95% confidence interval would be (2000-100, 2000+100) = (1900, 2100).
The 95% means that if you kept repeating the survey with the same design and sample size, ~95 of 100 confidence intervals will contain the true population mean. Of course, once again - practically, we only do one survey.
Does this help? Let me know if you have any more questions.
where $2000 is the mean of the sample.is that right? thank you
perfect, xyz.
Sharan,
Appreciate your efforts. A few questions, tho:
1. $3450 is not = (1000 + 2000 + 3000 + 2800)/4. In fact 3000 exceeds each of the 4 numbers. So how can "your" estimate be unbiased? I do see it has less bias (3450 vs. 2200) than Peter's (3450 vs. 7600). Was this just a typo?
2. Also, I recognize that each of the 4 #'s is itself a sample mean (with no info on sample sizes). But, as you point out, the "mean of means" should be your best estimate. Why cannot one compute a StdDev of this first example with 4 #'s? I.e. why do you need to illustrate the s/sqrt(n) formula with another example with n=100? Is it because the first 4 #'s were themselves not one sample, but instead, 4 sample means? I.e. is it because one should expect less variation across these means than the "true" one?
4. Also, when you present the 100 respondent example (mean = 2000, StdDev = 500), s/sqrt(n) = 500/10 = 50. So the interval you mention is a +/- 2*sigma one, correct? And this is a confidence interval for *the mean estimate*.
5. Given (or despite point 4 above), is the following interpretation correct: "I can be 95% sure that student incomes in this population fall between 2000 +/- 2*500, i.e. (1000, 3000)"?
6. If the relevant population is finite, say at N, as realistically must be the case in your UMich examples, then as the size of the survey increases, then yes, the s/sqrt(n) formula tells me that you are getting more and more precise, but even at n=N, s/sqrt(N) > 0. I.e it would appear to suggest that even when one has polled every relevant respondent (the census), the sample mean is still off relative to the population mean. I'm a little confused. Should I simply keep in mind that the s/sqrt(n) formula is to be interpreted only for n < N? And/or is the "true" N here, somehow, infinity - and if so, would you please clarify how, intuitively, I can reconcile this with sense that realistically N must be finite?
These are a lot of questions. I hope you find the time at some point to add to you post and clarify them. Also, if I may make a suggestion (all this from my rusty understanding of statistics), could you post on Entropy? I mean provide intuitive
explanations of the sort you just gave this topic? I would think at least some of your other readers besides me encountered that in college.
Thanks a lot.
Sincerely,
sph
Hi sph,
Can you give me some time on this? Am slightly stuck with work. But will reply within this week itself. Thanks for your patience.
Hi Sharan,
Thank you for acknowledging my request. And please take your time with following up. No rush.
Your explanations (precision, accuracy, multiple surveys etc.) were full of insight. It helped that you illustrated them in the context of real-world examples
I, unfortunately, have encountered statistics only in a *mathematical* sense, from textbooks etc. What I missed was *intuition* - which, as in any field/subject, I would think, is key to true understanding. Besides which, my memory of these topics is rusty, to put it mildly.
Also, I see a typo in my prior post:
> In fact 3000 exceeds each of the 4 numbers. <
The 3000 above should be 3450.
Thanks, and looking forward to your reponse.
Sincerely,
sph
Thanks for your kind comments, sph.
Yes, it is indeed sad that a lot of statistics is taught without the intuition. I believe it is easier to teach it mathematically but tougher to provide intuition. Of course, others may have different views.
Sorry for the delay in replying, sph. Was really tied up with work.
1. $3450 is not = (1000 + 2000 + 3000 + 2800)/4...Was this just a typo?
Totally, sph. Thanks a million for brining it to my notice. Have corected the population value to $2200.
2...the "mean of means" should be your best estimate.
Yes. But in real life, we would only conduct one survey due to time and cost limitations.
> one should expect less variation across these means than the "true" one?
Yes, that's right...when doing a s/sqrt(n) calculation we are using "s" in the numerator while we should actually be using "sigma".
What the theorem tells us is that if the original distribution of *individual* incomes is distributed with population standard deviation "sigma", the disribution of the sample *means* will be distributed approximately normally with a standard deviation equal to sigma/sqrt(n).
Since we usually don't have the value of "sigma", we use "s" as a substitute. As you can see the spread of the distribution of sample means is lesser than the original individual distribution of incomes. The s/sqrt(n) will be equal to the standard deviation of the sample means (in this case, may not be since we have just four estimates of the mean) - called the standard error of the sample mean.
4. ...so the interval you mention is a +/- 2*sigma one, correct?
Perfect - the two being the multiplier for a 95% confidence interval here.
>And this is a confidence interval for *the mean estimate*.
Actually, for the one estimate that we get. Here the estimate is itself the one sample mean (not the four sample means in the earlier post example).
5. Given (or despite point 4 above), is the following interpretation correct: "I can be 95% sure that student incomes in this population fall between 2000 +/- 2*500, i.e. (1000, 3000)"?
Ah! that's a great question. And the answer is "No". See, when you are 95% sure, it's like you are assigning probabilities. But, either the true (population) average falls in the CI or doesn't. i.e a probability of zero or one - nothing in between. So, when we talk about a 95% CI, we only mean that if the survey was repeated many many times, 95% of the intervals would contain the true population value.
6. > ....the s/sqrt(n) formula tells me that you are getting more and more precise, but even at n=N, s/sqrt(N) > 0. I.e it would appear to suggest that even when one has polled every relevant respondent (the census), the sample mean is still off relative to the population mean...how, intuitively, I can reconcile this with sense that realistically N must be finite?
Another great question.
I think the easiest way to resolve this is understanding that we get different sample estimates because there are different ways of picking n items out of N in the population. Then you actually can do a standard deviation of the distribution of sample means - s/sqrt(n) and use this to estimate your confidence interval. But when you do all N, apart from the measurement error issue(which can be ignored right now), you'll repeatedly get the same estimate each time - there is no real distribution. And hence no CI to derive.
Importantly, when we say the formula is s/sqrt(n), it is actually (1 - n/N)* s/sqrt(n). We usually ignore the n/N factor since we typically sample a very small proportion of the population. But in your example, the n/N = 1, and hence the whole term would become zero. !
Post a Comment